
Insights and articles
Deep dives, fresh ideas, and stories from the experts at Datashift.
.png)
Data Products Need Funding. Not Projects.
Your data product strategy is not failing because of your technology. It is not failing because of your talent. It is hitting a wall because you are trying to run a product organisation on a project budget. These two models are fundamentally incompatible.

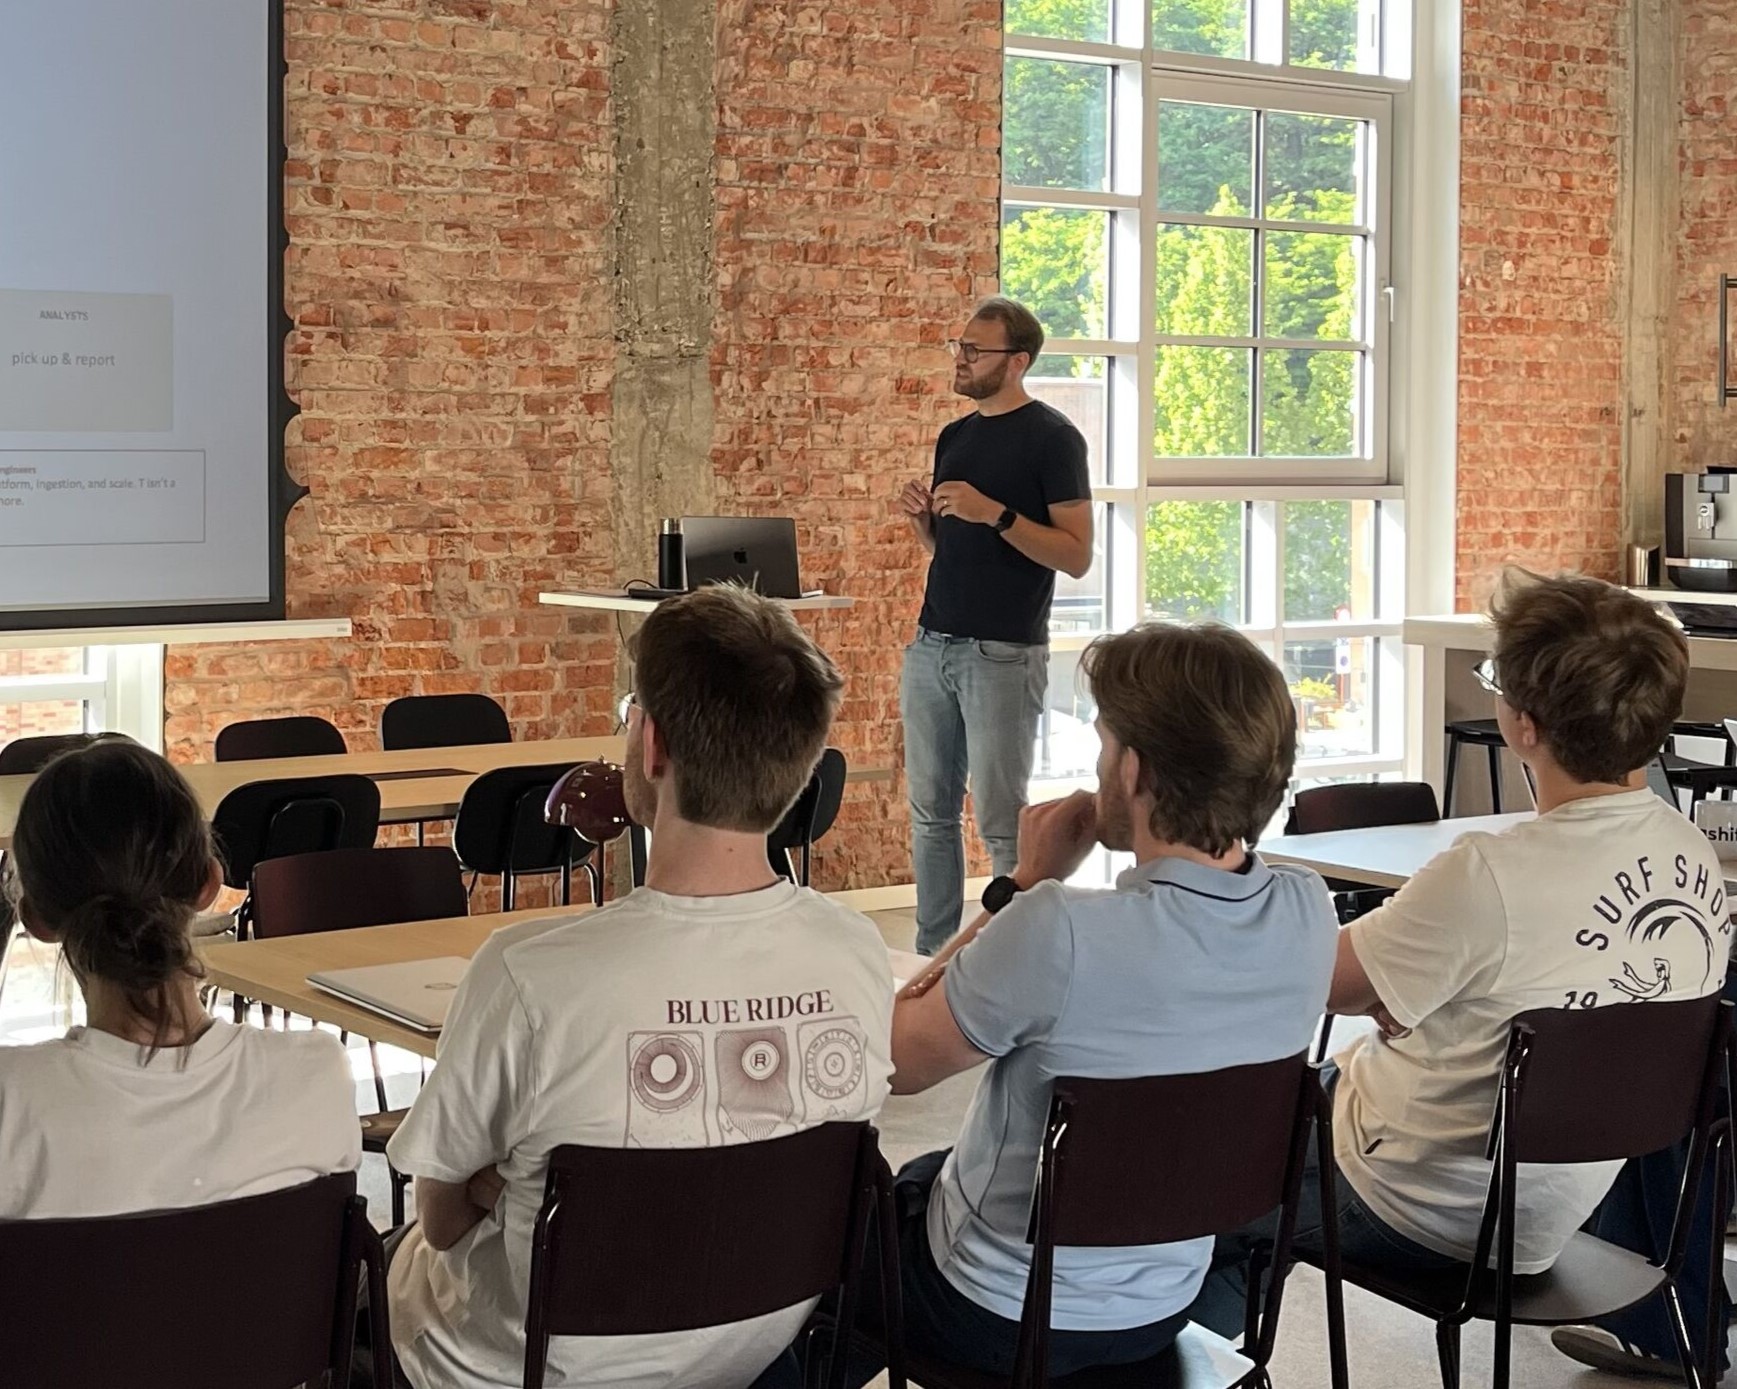
From Messy Documents to Governed Knowledge: What Our Hackathon Revealed About AI Agents
Most of an organization's knowledge lives outside structured systems: slide decks, meeting notes, contracts, feedback forms, and old project folders. This knowledge was the focus of a recent Datashift hackathon.

.png)
Centralized or Decentralized? Building a Silver Layer that does both with dbt
Most data teams are stuck choosing between consistency and speed: central control brings governance but creates bottlenecks, while domain ownership brings agility but leads to chaos. This blog explores a hybrid Silver layer that delivers both, using dbt as the framework to make it work.
.jpg)
.png)
How to Bring Shadow AI Out of the Dark (Without Slowing Your Team Down)
Somewhere in your organization, right now, an employee is pasting customer data into ChatGPT. This is Shadow AI. And if you think it's not happening in your company, you're almost certainly wrong.

.png)
From data chaos to business impact: how to tap into your invisible goldmine
When 90 percent of your information is unstructured, it creates a massive "invisible" friction. It turns daily operations into a series of manual search traps and missed signals, where the more data you collect, the harder it becomes to actually know what is happening inside your own organization.

.png)
The OpenClaw Symptom: Why Your Enterprise AI Strategy is Failing (and what to do about it)
Last month, an open-source AI agent called OpenClaw accumulated 145,000 GitHub stars in weeks. It can book restaurants, manage calendars, and commit code without being asked twice. Researchers have also demonstrated full system compromise via a single malicious email, in under five minutes. We're not suggesting you install it. But the speed at which 145,000 developers rushed toward something that dangerous is worth taking seriously, because it tells you something about the state of enterprise AI that your quarterly review probably doesn't.

.png)
From hidden experiments to confident Gen AI adoption
Employees experiment quietly with AI tools to summarize documents, draft emails, analyze data, or speed up daily work. These initiatives are rarely malicious or careless. On the contrary, they are often driven by curiosity, pressure to deliver faster, or genuine innovation. Yet taken together, these hidden experiments form a pattern that deserves attention: Shadow AI.
.png)
This Time it's Different: Why GenAI Demands a New Playbook
Transitioning from experimental AI to reliable, production-ready systems requires a fundamental shift in how you build, monitor, and govern your applications.

.png)
Data Governance Engineering: Making Governance Invisible
"Good governance shouldn't slow you down; it should help you move faster with confidence." This is the work philosophy of Arnaud Gueulette, a Data Governance Engineer at Datashift. In the world of data governance, Datashift proves that governance doesn't have to be a roadblock. Instead, it can be the invisible backbone that enables agility, compliance, and collaboration; without the friction.

.png)
Engineering First: Building Trustworthy (Gen)AI at Scale
GenAI is powerful and exciting but without strong foundations, it quickly becomes a liability. Treat your GenAI stack like any other enterprise-grade system: with governance, security, scalability and operational excellence baked in from day one.

.png)
Our Take on NASA’s Milestone: Perseverance’s First AI-Driven Path
In December, NASA engineers used Claude, an advanced multimodal AI model developed by Anthropic, to plan a route for the rover, marking the first AI-planned journey on Mars. How was NASA able to leverage GenAI for this task? The first AI‑planned drive on Mars marks more than a technical milestone, it shows how human expertise and advanced AI can meaningfully accelerate scientific progress.

Why Modern Data Teams Are Rethinking Warehouse Costs with dbt Fusion
How a ground-up engine rewrite is delivering cost savings, faster development, and a foundation for GenAI

.png)
Wabi-Sabi Data Governance: Why Good Enough Data Is Your Competitive Advantage
Wabi-Sabi data governance philosophy.

.png)
Before You Ask GenBI, Build the Foundations
The evolution of GenBI.

.png)
Introducing data domain thinking as a no-regret move towards fixing messy data
Organizing data around core business entities.
.png)
LLM Data Security: From Business Risks to Responsible AI Innovation
What happens to your data in LLM tools.

.png)
What Are AI Agents? Benefits, Risks & Business Readiness Guide
Understanding AI agents.
.png)
The end of Fabric Default Semantic Models and what it means for you
Default semantic models sunset impact.

.png)
Tackling AI Risks: Insights from assessing a GenAI Chatbot
Responsible AI risk assessment workshops.

From chaos to clarity: how dbt streamlines analytics projects and promotes collaboration
Data transformations with dbt.

.png)
The Power of Product Thinking in Data Management to increase business success
Product thinking for data impact.

.png)
From Planning to Execution: Our Recipe for a Successful Power BI Migration
Power BI migration strategy.
.png)
.png)
Predicting Platelet Demand: Transforming Healthcare Logistics with Time Series Forecasting
Advanced analytics in healthcare supply chains.

Taking responsibility: Governing AI to generate value while managing risks
Responsible AI risks and controls.
.png)
Tech Review: Tracing Data Lineage from Notebooks into Microsoft Purview
Spark lineage integration with Purview.

How Collibra and SAP are revolutionizing Data Governance by Bridging the Enterprise Data Divide
SAP data governance challenges.

When Data Governance Meets Data Engineering: Optimizing Microsoft Purview with SparkLin for Automated Lineage
The importance of data lineage.

Microsoft Fabric: Breaking Down Barriers to Modern Analytics
Fabric as a unified modern data platform.

.png)
From Pitfalls to Power (BI): Top 3 Challenges We See Most Often
Three Power BI pitfalls to avoid.
.png)
One-Stop Shop for Data Governance: Why Collibra is a Game-Changer
Collibra?s continued evolution.

Implementing Microsoft Fabric: Insights and Best Practices
Real-world experience with Microsoft Fabric.

.png)
Self-Service BI: Blessing or Burden? Dive into Benefits, Challenges, and Solutions
Self-service BI benefits and pitfalls.
.png)
Is your data governance stuck in excel? It's time to upgrade!
Why modern data governance tools matter.

How to Leverage your Competitive Advantage in the Era of AI
Fine-tuning AI on proprietary data.

Switch before it Hurts: Discover the wins of reporting in Power BI
Power BI enabling the next growth wave.

How to get Generative AI working in your business
Limits of generative AI in business.

From Data Resistant to Data Literate
Change management during data transformations.

Accelerating Spark Notebook Development with MSSparkUtils for Microsoft Fabric
Using MSSparkUtils in Fabric.

How to build a cost-effective and robust streaming data pipeline
Clickstream ingestion with Snowplow.

Automated Data Classification - 3 Methods to reduce your efforts significantly
Automating data classification.

Fabric Default Semantic Models: One for all, all for one!
Default semantic models in Microsoft Fabric.
.png)
10 Crucial Tips for Effective KPI Dashboarding
Modern performance management with data.

CSRD Reporting Beyond Compliance: Building Robust Data Governance for Sustainable Success
CSRD and ESG reporting requirements.
The state of large language models? Where are we now? A business perspective
Why organizations should start with AI today.
.png)
Anticipating the EU AI Act - What Every Business Should Ask Itself Today
The impact of the EU AI Act.
Enhancing data validation processes with Microsoft Fabric
The importance of data validation.
Microsoft Fabric is general available, when and why should you care?
What deploying Microsoft Fabric means for your organization.

What Amazon and Twitch can teach us about Data Governance
Leadership lessons from Jeff Bezos and Steve Huffman.

An evening talking Data Governance, my key takeaways
Lessons from a Data Governance roundtable.

.png)
How to protect sensitive customer data without a single line of code
Centralized access control with Collibra Protect.
Is a Customer Data Platform the best solution for you?
Why CDPs are not plug-and-play solutions.

What you need to know about a Customer Data Platform
Customer Data Platforms explained.
.png)
Four essential steps to build a game-changing data marketplace
Lessons from Collibra Data Marketplace implementations.

Is the Generative AI hype real? A look at the AI Gartner Hype Cycle
Is AI hype real?
How Hyperscale comes to the rescue when troubleshooting Azure SQL Server performance
Solving performance issues with Hyperscale.

.png)
Data-Driven Marketing: Embracing Data Science and AI for Success
AI-driven marketing use cases.

[drumbeats] Collibra's Workflow Designer enters the stage
Exploring new data products for professionals.


The European AI act: a critical review of what you've heard in the news
Nuancing AI narratives in the media.
Building an Ethical Framework for Generative AI
Responsible AI guidelines from KU Leuven.

Three out of four Flemish companies still make no use of AI
Challenges in AI adoption in Flemish organizations.
.png)
Microsoft Fabric: The Game-Changer in Data Analytics?
Microsoft Fabric introduction and first insights.
5 factors that make your data team successful
Five factors that make data teams successful.
Spark your Infrastructure: Terraform to deploy AWS Glue Pyspark job
Infrastructure as Code using Terraform.
.png)
Let's face it: data doesn't drive business value
How to quantify the value of data projects.
.png)
.png)
AI: The Future is Now - Are You Ready to Embrace it?
The evolution and future impact of AI.

.png)
Kickstart Data Quality by Design with Great Expectations
Data Quality by Design with Great Expectations.
How to query your S3 Data Lake using Athena within an AWS Glue Python shell job
Using AWS Glue Python shell jobs effectively.

3 priceless tips to help you succeed in Data Governance user adoption
Boosting data governance user adoption.
Semantic data discovery: separating facts from fairy tales
Semantic data discovery in practice.

.png)
Monitoring data quality just got easier with Soda
Business-friendly data quality with Soda.

Everything you really need to know about a data lakehouse
The evolution of data warehouses, lakes and lakehouses.
What an event-driven architecture brings to the table to solve your data ingestion challenges
Event-driven data ingestion architectures.
How a data hub helps you step up customer engagement
Operational data hubs for business users.

Who knows who: from Hollywood to Flanders
Graph analysis sequel using shortest path algorithms.

Get ready for the future. Meet Azure Synapse.
Getting started with Azure Synapse Analytics.

Laying the groundwork for a modern data platform
Building a cloud-first modern data platform.

Why a lightweight cloud analytics lab goes hand in hand with your BI environment
Using cloud analytics labs as a modernization step.

How can AI & ML strengthen data governance practices?
AI and machine learning in data governance.


How to move your on-premises data warehouse into the cloud
Navigating cloud data warehouse migrations.

Kick-starting your data governance track with Collibra automation
Why Collibra is still our favorite Data Governance tool

.png)
Is Data Warehousing still relevant for your business?
Why data warehousing still matters.

AI is on the rise. So are AI safety and ethical AI.
The rise of ethical and responsible AI initiatives.

Data governance for banks: From defense to offense
From defensive to offensive data governance in banking.
.png)
How to auto-scale your Azure SQL database in Azure Data Factory
Autoscaling Azure SQL databases using Azure Data Factory.
.png)
Kick-start your data governance program with a business glossary
Solving data misunderstandings across departments.
Azure Data Factory vs on-premise ETL tools
Choosing between Azure Data Factory and on-prem ETL tools.
AI for everyone? It's no alchemy run by wizards!
Practical guidance for adopting AI in organizations.

How to build a churn prediction model that actually works
Turning churn prediction into actionable retention.


.png)